Contents
Anthropometry Domain
IntroductionSubjective methods- Introduction to Subjective Methods
- Birth weight
- Body shape
- Weight and height
- Waist and hip circumference
- Introduction to Objective Methods
- Simple measures - stature
- Simple measures - weight
- Simple measures - circumference
- Simple measures - arm anthropometry
- Simple measures - skinfolds
- Simple measures - abdominal sagittal diameter
- Simple measures - head circumference
- Bioelectric impedance analysis
- Multi-component models
- Hydrostatic underwater weighing
- Air displacement plethysmography
- Hydrometry
- Whole body DEXA scan
- Near infrared interactance
- Whole body counting of total body potassium
- 3d photonic scan
- Magnetic resonance imaging (MRI) / Magnetic resonance spectroscopy (MRS)
- Total body electrical conductivity (TOBEC)
- Computed tomography (CT)
- Ultrasonography
- Introduction anthropometric indices
- Body mass index
- Fat and fat free mass indices
- Ponderal index
- Percentiles and Z-scores
- Anthropometry Video Resources
- Height procedure
- Protocol for measuring waist circumference
- Measuring hip circumference
- Weight and body composition procedure
Computed tomography (CT)
- Computed tomography (CT) is a radiographic method commonly used in medical imaging.
- In terms of its usefulness in body composition measurement, it produces thin cross-sectional high resolution images that can be processed to differentiate and measure volumes of fat and lean tissue. It provides important quantitative data on the composition of muscle and the distribution of adipose tissue. This is important in examining the relationships among skeletal muscle metabolism, lipid accumulation within muscle and muscle function.
- The images can also distinguish between different fat compartments e.g. visceral and subcutaneous adipose tissues.
- CT can also provide objective assessment of hepatic attenuation, which is related to liver fat content.
- Due to its high spatial and contrast resolution, it has the ability to measure fat and muscle content from one abdominal cross-sectional slice.
- CT is considered (along with MRI) to be the most accurate methods available to quantify in vivo body composition at tissue-organ level.
- CT is generally used to calibrate/validate other methods designed to estimate adipose tissue.
Image acquisition
The CT scanner is typically a large, box-like machine with a central aperture. The participant lies on an examination table that moves into and out of a short tunnel. Rotating around the participant, the X-ray tube and electronic X-ray detectors are located opposite each other in a ring, called a gantry. The X-ray beam is attenuated as it passes through the tissues before reaching the detectors opposite. As the X-ray beam is rotated around the participant, information on the intensity of the attenuated X-ray beam is collected and stored. The X-ray creates cross-sectional slices from 1-10 mm thickness through the participant. Complex algorithms are then applied to build cross-sectional images of the body, which can further be processed into 3D images.
The computer workstation that processes the imaging information is located in a separate control room, where the technologist operates the scanner and monitors the examination in direct visual contact with the ability to hear and talk the subject with the use of a speaker and microphone.
Attenuation coefficients
The intensity of the attenuated X-ray beam is expressed as a CT number (also known as the linear attenuation coefficient, or attenuation value). This number is a measure of attenuation relative to air and water expressed in Hounsfield units (HU):
- CT number of air = -1000 HU
- CT number of water = 0 HU
- CT number of bone = +1000 HU
Physical density is the main determinant of attenuation. Lower density tissues such as fat have lower HU values than higher density tissues such as muscle or bone.
The differences in attenuation coefficients among fat-free mass, adipose tissue, and bone make this technique appropriate for quantifying separate adipose tissue compartments and whole-body composition.
Cross-sectional CT images
Cross-sectional CT images are made up of pixels 1 mm by 1 mm square. Each pixel has a CT number or HU, which gives contrast to the image. Each pixel has a HU value on a gray scale that reflects the composition of the tissue. Low HU values correspond to low values for tissue density. Lower densities appear black (e.g. fat) and higher densities white (e.g. bone and muscle).
Single vs multiple slice CT images
To reduce radiation exposure, cost and processing time, a single slice CT image can be used to assess visceral adipose tissue (VAT) and subcutaneous adipose tissue (SCAT). In adults, the single slice is often performed at the level of the L3 vertebral body. However, this method is less accurate than whole abdomen imaging as the inter-individual variation in the distribution of VAT and SCAT across the abdomen is not captured by a single slice alone.
Studies of the whole abdominal region (from T10-T11 to L5-S1 vertebrae), or multiple slices from it, give a more robust estimate of adipose tissue deposition compared to single slice analysis.
Correlations of 0.89 to 0.99 between single scans and the average values for all scans show that a single CT image contains the same information on adiposity as a series of scans.
The following parameters need to be verified with a radiographer prior to image acquisition:
The method has been primarily used in smaller laboratory-based studies. However, it has been applied to population studies, like the Health ABC study, which collected both abdominal and midthigh CT images from approx. 3000 older individuals, and the Framingham Heart Study, which used abdominal multi-detector CTs in over 3500 individuals.
Practical and ethical constraints limit the general use of CT in body composition assessment.
Due to the exposure to ionizing radiation (10 mSv, the equivalent of 100 chest X-rays), the following are avoided:
- Routine whole body scans
- Multiple scans in the same individual
- Scans in radiation vulnerable populations, such as children, pregnant women and young adults
CT, together with MRI (Magnetic Resonance Imaging) is generally used to validate other methods designed to estimate adipose tissue and skeletal muscle.
- The analysis of the CT images is generally carried out by software installed on the scanner (e.g. Syngo Volume Calculation). Several other specialised software systems are available (e.g. Tomovision).
- From a CT image, tissue type can be distinguished, or segmented, based on the CT number, which represents the electron density of the tissue within a particular volume element (voxel).
- The software identifies the area of the target tissue by selecting pixels within a given HU range (e.g. -190 to -30 HU for adipose tissue, -29 to +150 for skeletal muscle, and +152 to +1,000 for bone).
- The tissue segmentation image analysis is used to determine tissue area, based on image morphology, a combination of edge detection filters and Watershed techniques (Mitsiopoulos et al., 1998).
- Once the pixels for a particular tissue have been identified, the area of the tissue is calculated by multiplying the number of pixels for that tissue by the surface area (cm2) of the individual pixels. Tissue volume (cm3) for each slice is calculated by multiplying the tissue area (cm2) by slice thickness.
Adipose tissue
- Using specialised tissue segmentation image analysis software, the difference in density between adipose vs non-adipose tissue can be quantified from the multiple 2D images generated by the scanner that may form non contiguous or contiguous 3D image volumes at a high resolution.
- X-ray attenuation depends on matter density and is expressed in Hounsfield units (HU). CT numbers for adipose tissue range from -190 to -30 HU.
- Once segmented (manually or automatically using specialised software), tissue area can be determined using known in-plane dimensions of the CT image and tissue volume can be calculated using the slice thickness for a single slice, or a volume estimate can be made using the average cross-sectional area of two nearby slices and the distance between slices.
- The visceral adipose tissue is defined as the tissue bound by parietal peritoneum or transversalis fascia, excluding the vertebral column and the paraspinal muscles.
- Subcutaneous fat is fat superficial to the abdominal and back muscles. This compartment can be further subdivided into superficial and deep sub-compartments using the fascia superficialis (see Figure 1).
- For a contiguous set of slices, the volume calculation for each adjacent slice pair can be added to derive a total volume.
- Volumes can then be transformed to mass by multiplying the volume by the assumed density values for that tissue. For instance, the total adipose tissue can then be estimated by using density values available in the literature, e.g. 0.92 kg/L.
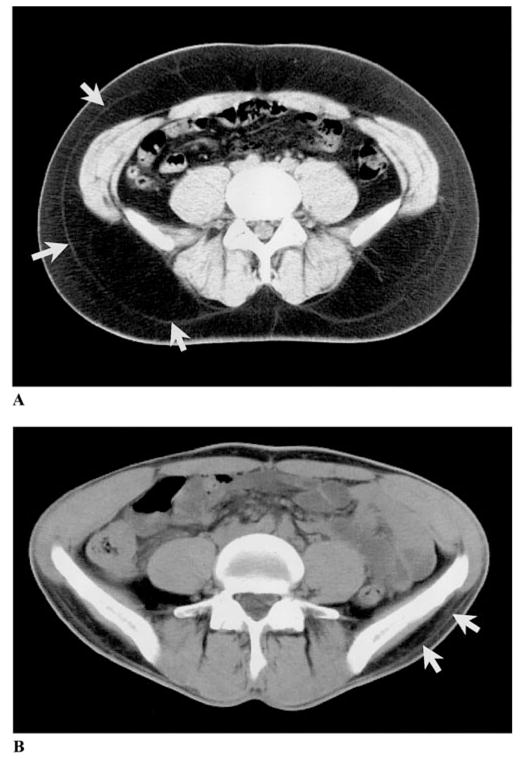
Figure 1 Abdominal axial CT scans of a large individual (A) and a thin individual (B). Subcutaneous adipose tissue is divided into superficial and deep subcutaneous adipose tissue by a fascial plane, as indicated by the white arrows.
Source:
[15].
Skeletal muscle
- Skeletal muscle is measured as the mean CT number from all pixels within the range of 0-100 HU, excluding most of the intermuscular, or “marbled,” adipose tissue in the analysis. Because of the limited resolution of CT, however, depots of extracellular adipose tissue smaller than the pixel’s resolution cannot be completely excluded.
- Skeletal muscle is measured either segmenting all muscle or the psoas muscle. To quantify skeletal muscle in the abdomen, a 10mm cross sectional image of the abdomen at the level of L3 is typically required. The lower the CT number, the greater the infiltration of fat within the muscle.
Ectopic fat
Liver fat infiltration
- Liver fat infiltration is calculated by determining the CT numbers for each voxel within a region of interest in the liver. CT numbers depend on the molecular composition of the tissues within each voxel. Fat has a lower density than water and protein, and liver fat infiltration is reflected by a lower liver density and thus CT numbers.
- As normal and fatty liver CT numbers overlap, liver density (CTL) is expressed relative to the spleen attenuation value (CTS), which is not infiltrated with fat.
- The liver is a denser organ than the spleen and has a higher CT number.
- A liver-to-spleen attenuation (CTL/CTS) ratio of less than one indicates fatty infiltration.
- Two to three regions of interest within the liver and spleen are generally implemented to derive the liver and spleen mean CT numbers. However, it is preferable to assess the whole liver and spleen surface areas to determine respective mean CT numbers.
- Imaging of the entire liver and spleen involves a large tissue volume and subsequent high radiation dose, therefore, a single axial image at the T12-L1 inter-vertebral space is used as the optimal landmark for determining both liver and spleen CT numbers. When using this landmark the liver and spleen is typically identified in approximately 90% of time in adult individuals.
Intra muscular fat infiltration
- The average HU or mean CT number of adipose tissue-free skeletal muscle voxels is used as an index of skeletal muscle fat content.
- The lower the skeletal muscle CT number or the greater the number of low-density skeletal muscle voxels (e.g. 0-30 HU), the higher the skeletal muscle fat content.
- Fat is typically stored both inside and outside the muscle cell and CT muscle CT numbers reflect both intra-myocellular (IMCL) and extra-myocellular (EMCL) lipid content. Although similar, they are not the same as intra-myocellular lipid values are determined via skeletal muscle biopsy or proton magnetic resonance spectroscopy.
An overview of the characteristics of computed tomography is outlined in Table 1.
Strengths
- The main advantage of CT is its ability to discriminate total fat content into subcutaneous and visceral components. CT has the ability to measure fat infiltration in skeletal muscle and liver.
- It produces high resolution images and tissue CT numbers are consistent within the image data set. The consistency of attenuation data allows development of standardised protocols for evaluating images and defining tissues.
- Strong correlations of 0.77 to 0.94 for adipose tissues from CT and measurements of these tissues in human cadavers (direct method).
- Highly reproducible as the reported error for total adipose tissue volume after performing 28 scans is 0.4%. Visceral and subcutaneous adipose tissues can be accurately measured with errors of 1.2 and 0.5%, respectively.
Limitations
- The radiation exposure from CT limits its use in longitudinal data collection where serial measures would be necessary, and in vulnerable populations, such as children and young adults.
- Can be limited in use in individuals with claustrophobia.
- There are weight and girth measurement limits for the scanner table and gantry.
- Research access to CT may be limited due to high volume clinical imaging requirements.
- Expensive and requires technical skills.
- The presence of iron, copper, glycogen, fibrosis, or oedema confounds attenuation values, leading to errors in fat quantification and low sensitivity for mild-moderate liver steatosis.
- The use of some drugs such as amiodarone is known to increase the attenuation of liver, and confounds the ability of CT to quantify fat.
- Values determined by CT are not the same as biopsy and MR technologies (MRI and MRS), making data harmonisation between studies that used different methods challenging.
Table 1 Characteristics of computed tomography.
| Consideration | Comment |
|---|---|
| Number of participants | Small |
| Relative cost | High. Often to reduce cost and processing time, a single slice CT image at L3 in adults is used. However, this method is less accurate than the whole abdomen imaging method as the inter-individual variation in the distribution of VAT and SCAT across the abdomen is not capture by a single slice. |
| Participant burden | Low |
| Researcher burden of data collection | Low |
| Researcher burden of data analysis | Medium. Often to reduce cost and processing time, a single slice CT image at L3 in adults is used. However, this method is less accurate than the whole abdomen imaging method as the inter-individual variation in the distribution of VAT and SCAT across the abdomen is not capture by a single slice. |
| Risk of reactivity bias | No |
| Risk of recall bias | No |
| Risk of social desirability bias | No |
| Risk of observer bias | No |
| Space required | High |
| Availability | Medium |
| Suitability for field use | Not suitable |
| Participant literacy required | No |
| Cognitively demanding | No |
Considerations relating to the use of CT in specific populations are described in Table 2.
Table 2 Anthropometry by CT in different populations.
| Population | Comment |
|---|---|
| Pregnancy | No* |
| Infancy and lactation | No* |
| Toddlers and young children | No* |
| Adolescents | No* |
| Adults | Yes |
| Older adults | Yes |
| Ethnic groups | Yes |
| Athletes | Yes |
| Other (obesity) | Yes, however some scanners may not always accommodate large individuals (BMI >40 kg/m2) |
*Because foetus’ and children are more sensitive to radiation, they should have a CT exam only if it is essential for making a diagnosis and not for body composition, unless absolutely necessary and justifiable. Refer to the further considerations section. If CT is used to assess abdominal adipose tissue, a single site is preferable due to concerns with radiation exposure. In children, a single slice higher than L4-L5 level (typically L2-L3 in girls and L1-L2 in boys) has been shown to better represent visceral adipose tissue in the abdomen.
Safety and ethical considerations
- Most countries require that the legal person responsible for the Computer Tomography suite apply to the radiation protection regulatory body for authorization - either via registration or a licence.
- The relevant regulatory body will require information necessary to demonstrate the protection and safety of the practice. Typically, this includes information on the medical practitioners and technologists/operators involved; their education and training in radiation protection; details on the CT equipment and the room where it is to be located; facility quality assurance (QA) and the facility’s radiation protection programme for staff, patients/study participants and general public protection.
- In both clinical and research environment, all medical exposures are required to be appropriately justified (e.g. justification steps would include: ensuring that the CT exam is necessary to answer a clinical question, considering other examinations to answer the clinical question/research question that use less or no radiation exposure (e.g. MRI or ultrasound). The diagnostic benefit from CT must outweigh the radiation detriment that might ensue. In medical research, the benefit from the use of radiation is expected to be accrued by society, such as through improved health care options. The use of CT procedures in this role must also be justified by an ethics committee.
- In the UK, the IR99 (statutory regulations for the use and control of ionising radiation) and IRMER 2000/2006 regulations (legislation intended to protect the patient/participant from the hazard associated with ionising radiation) are applied.
What are the radiation risks from CT scanning?
- Although the doses used in CT are higher than those used in conventional radiographic examinations, they are still 10 to 100 times lower than the dose levels that have been reported to increase the risk of cancer. Despite the fact that at the low doses associated with a CT scan the risk either is too low to be convincingly demonstrated or does not exist, the magnitude of the concern among patients and some medical professionals that CT scans increase cancer risk remains unreasonably high.
- A CT examination with an effective dose of 10 millisieverts (abdominal CT = 8 millisieverts) may be associated with an increase in the possibility of fatal cancer of approximately 1 chance in 2000. This increase in the possibility of a fatal cancer from radiation can be compared to the natural incidence of fatal cancer in the US population, about 1 chance in 5 (equal to 400 chances in 2000). In other words, for any one person the risk of radiation-induced cancer is much smaller than the natural risk of cancer. If you combine the natural risk of a fatal cancer and the estimated risk from a 10 mSv CT scan, the total risk may increase from 400 chances in 2000 to 401 chances in 2000.
- Radiation exposure is a concern in both adults and children. However, there are three unique considerations in children.
- Children are considerably more sensitive to radiation than adults, as demonstrated in epidemiologic studies of exposed populations.
- Children have a longer life expectancy than adults, resulting in a larger window of opportunity for expressing radiation damage.
- Children may receive a higher radiation dose than necessary if CT settings are not adjusted for their smaller body size.
- The risk for developing a radiation-related cancer can be several times higher for a young child compared with an adult exposed to an identical CT scan. The use of CT in paediatric research is therefore limited due to these safety/ethical issues.
Refer to section: Practical considerations for objective anthropometry
- CT Scanner, space, operator/technician/radiographer and radiologist to read the scan results
- Specialized software
- Technical skills for data acquisition, data processing and analysis are required
- Collaboration with a research group experienced in this technique is strongly recommended
A method specific instrument library is being developed for this section. In the meantime, please refer to the overall instrument library page by clicking here to open in a new page.
- Ashwell M, Cole TJ, Dixon AK: Obesity: new insight into the anthropometric classification of fat distribution shown by computed tomography. Br Med J 1985; 290: 1692
- Borkan GA, Gerzof SG, Robbins AH, Hults DE, Silbert CK, Silbert JE: Assessment of abdominal fat content by computed tomography. Am J Clin Nutr 1982; 36: 172
- Boutin RD, Yao L, Canter RJ, Lenchik L : Sarcopenia : Current concepts and imaging implications 2015; 205: W1 – W 12.
- Goodpaster BH, Thaete FL, Kelley DE: Composition of skeletal muscle evaluated with computed tomography. Ann NY Acad Sci 2000; 904: 18
- Goodpaster BH, Kelley DE, Thaete FL, et al. Skeletal muscle attenuation determined by computed tomography is associated with skeletal muscle lipid content. J Appl Physiol 2000; 89: 104–110
- Greenfield JR, Samaras K, Chisholm DJ, Campbell LV. Regional intra-subject variability in abdominal adiposity limits usefulness of computed tomography. Obes Res. 2002; 10(4): 260–5
- Heyward VH: Advanced Fitness Assessment & Exercise Prescription. 2nd ed. Champagne, Ill.: Human Kinetics; 1991
- Heymsfield S, Ross R, Wang Z, Frager D: 5 - Imaging Techniques of Body Composition: Advantages of Measurement and New Uses. In: Emerging Technologies for Nutrition Research: Potential for Assessing Military Performance Capability; Institute of Medicine (US) Committee on Military Nutrition Research; Carlson-Newberry SJ, Costello RB, editors. Washington (DC): National Academies Press (US); 1997
- Lustgarten MS, Fielding RA: Assessment of analytical methods used to measure changes in body composition in the elderly and recommendations for their use in phase II clinical trials. J Nutr Health Aging 2011; 15: 368
- McArdle WD, Katch FI, Katch VL: Essentials of Exercise Physiology. 3rd ed. Philadelphia: Lippincott Williams & Wilkins; 2006
- McCollough CH, Bushberg JT, Fletcher JG, Eckel LJ: Answers to Common Questions About the Use and Safety of CT Scans Mayo Clin Proc 2015; 90: 1380
- Mitsiopoulos, N., R. N. Baumgartner, S. B. Heymsfield, W. Lyons, D. Gallagher, and R. Ross. Cadaver validation of skeletal muscle measurement by magnetic resonance imaging and computerized tomography. Journal of applied physiology 1998; 85(1): 115-122.
- Norgan NG: Laboratory and field measurements of body composition Public Health Nutrition 2005; 8: 1108
- Plourde G: The role of radiologic methods in assessing body composition and related metabolic parameters. Nutr Rev 1997; 55: 289
- Shen W, Wang Z, Punyanita M, Lei J, Sinav A, Kral JG et al. Adipose tissue quantification by imaging methods: a proposed classification. Obes Res 2003; 11: 5–16
- Vugt, J, Levolger S, Gharbharan A et al : A comparative study of software programmes for cross-sectional skeletal muscle and adipose tissue measurements on abdominal computed tomography scans of rectal cancer patients. Journal of Cachexia, Sarcopenia and Muscle 2017; 8: 285-297
- Walsh L, Shore R, Auvinen A, Jung T, Wakeford R: Risks from CT scans-what do recent studies tell us? J Radiol Protect 2014; 34: E1
- Wells JCK, Fewtrell MS: Measuring body composition Arch Dis Child 2006; 91: 612

- The Toolkit
- About
- What's new
- Other resources
- Toolkit Team
- Contact
- Links to other toolkits
- Nutritools
- NCI/NIH Dietary Assessment Primer
- © 2026 MRC Epidemiology Unit
- Privacy policy and cookies
- Terms of Use